
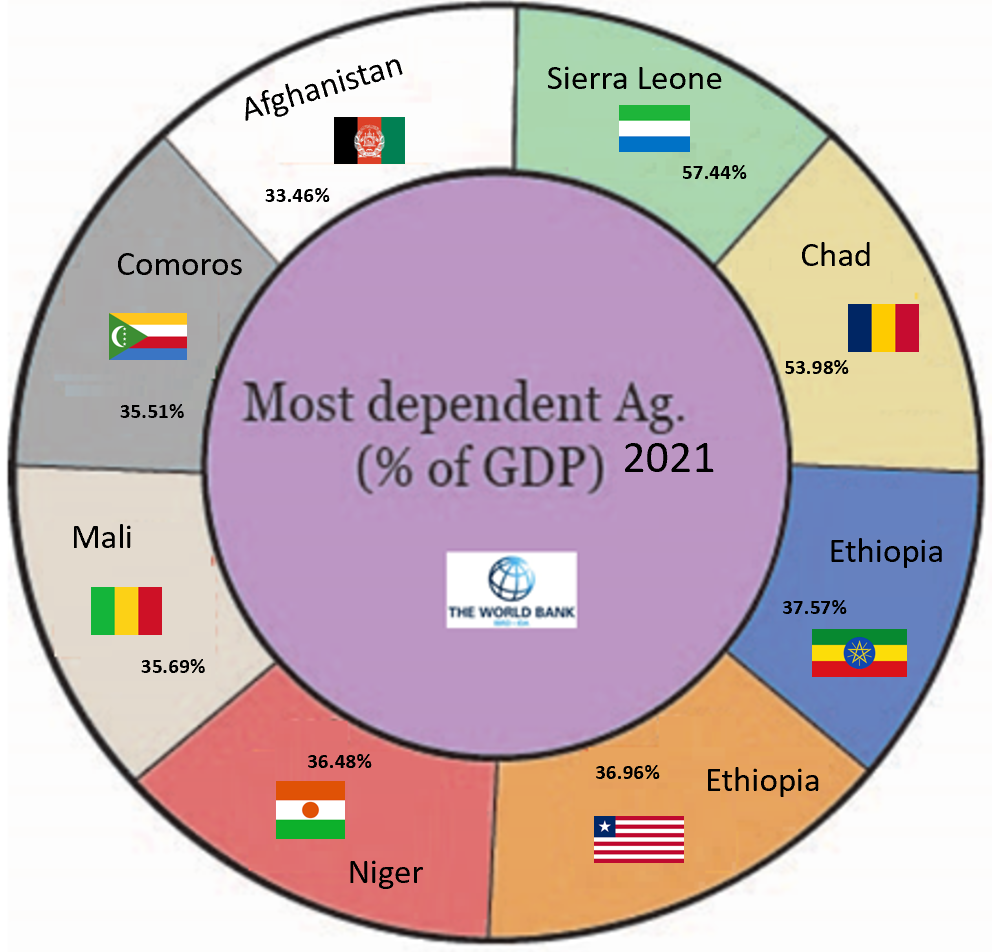
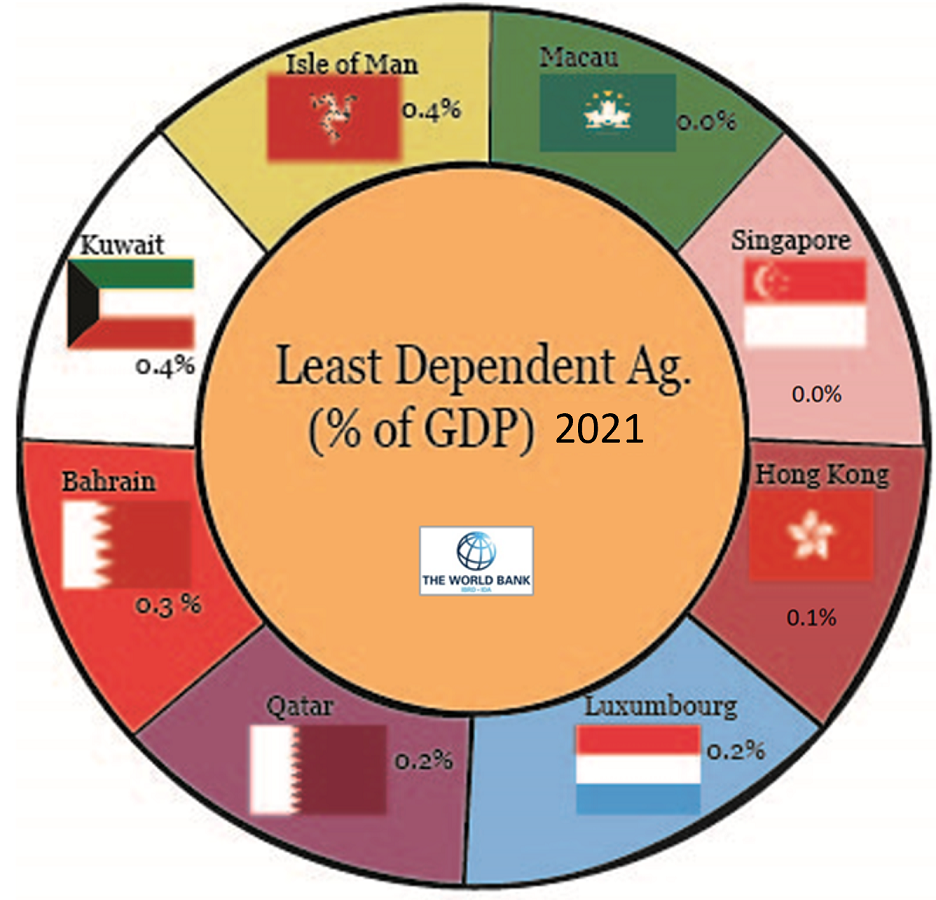
Globally, agriculture is one of the biggest industries, and therefore one of the largest employers; in 2021, agriculture contributed to 3.272% (Source: The World Bank ) of the global gross domestic product (GDP) and, in some developing countries, it can account for more than 25% of the (GDP).
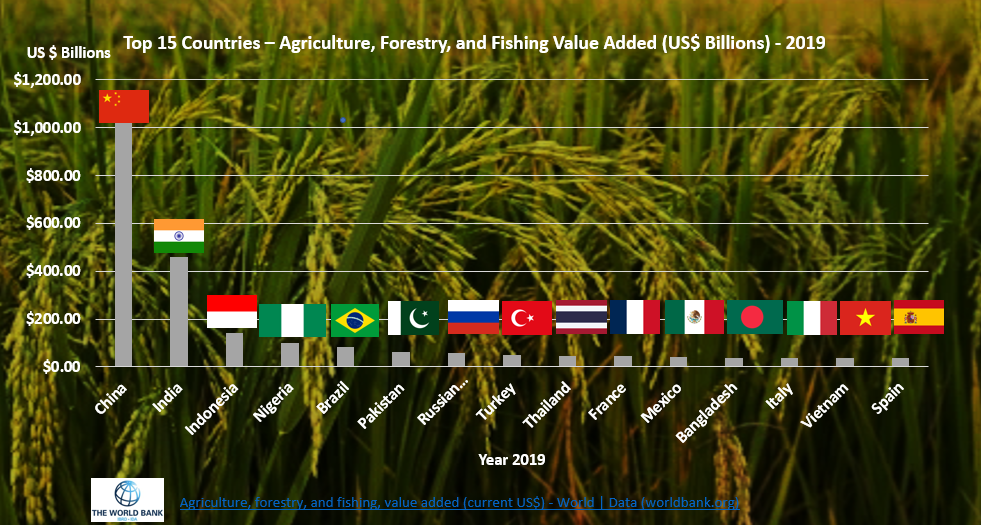
Globally, food and agriculture businesses form a $5 trillion industry that is constantly growing. In 2021, the largest agricultural output came from China ($1.28 trillion), then India ($534.209 billion), the Unites States of America ($223.724 billion), Indonesia ($157.521 billion),Brazil ($110.879 billion) and Nigeria ($102.966 billion) ( (World figures).
Countries whose GDP grew tremendously due to agriculture include, China, India, the United States of America, the Republic of Indonesia, Brazil, Liberia, and Somalia. Countries whose GDP is predominantly agricultural include, Sierra Leone,Chad, Ethiopia,Liberia, Niger, Mali, Comoros and Afghanistan. It is no wonder that the agriculture employees around 65% of adults worldwide and many are small scale farmers.
In summary, agriculture is the foundation of a nation's economy and industry, and small farmers are the main labor force that enables it. The economic development of a country relies heavily on how it supports its small farmers, so looking after small farmers is in the best interest of a country.
We provide data science and analytics solutions that help small farmers improve their crop yield, profit, and unique suggestions. Our platform focuses on food security and connects crops, macroeconomics, supply chain, and pricing models. We use heuristics at the farm level and the small farm producer level to produce linear heuristics that optimize the highest yield at the farm level.
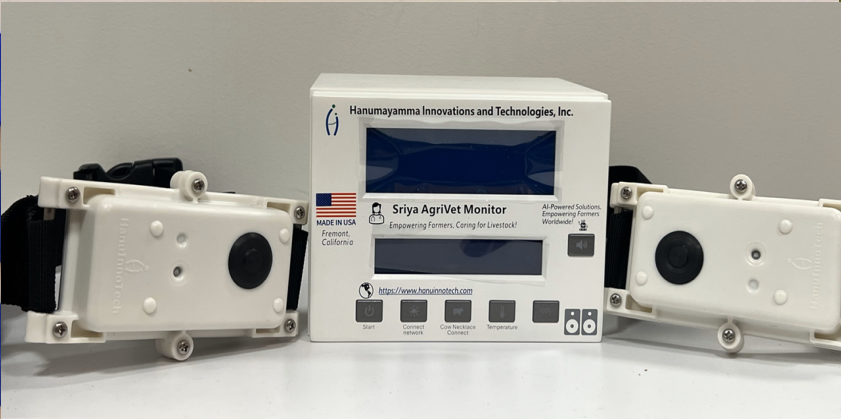
Hanumayamma sensors are available in multiple configurations and powered by AI agents that require specific analysis and calibration. Submitting an Intent-to-Buy (ITB) enables our team to assess requirements, confirm availability, and recommend the optimal sensor configuration before final confirmation.
Any online intent-to-buy submissions, expressions of interest, or purchase inquiries made through this website are treated as non-binding requests.

Please download the Intent-to-Buy form, complete it, and submit the filled document via email to:


Our World class analytics is for our World class farmers and agricultural equipment manufacturing companies:
 Small Farmers & Producers Advanced Analytics to help farmers to optimize Crop patterns and reduce farm input costs
.
Small Farmers & Producers Advanced Analytics to help farmers to optimize Crop patterns and reduce farm input costs
.

 Banks & Insurance Companies Proactive Analytics to help Banks and Insurance managers to better plan mitigating market/climate/crop risks.
 Agricultural Equipment Manufacturers (Fertilizers, Tractors, and others) Farm Heuristics help Fertilizer and Farm Equipment companies to optimize supply chain and reduce costs.
 Food Industries Agricultural Co-operatives, Retail Food Chains, and Food Industries .
 State & Local governments Macroeconomic, Agricultural, and Food Security Advanced Analytics help Governmental and Local/State Institutions to better plan Food and Nutrition Security.
 Research Laboratories Real-time Farm & Sensor Data will enable research institutions, Farm manufacturers, and Fertilizer companies to better plan product based on the geo-location & climate variants.
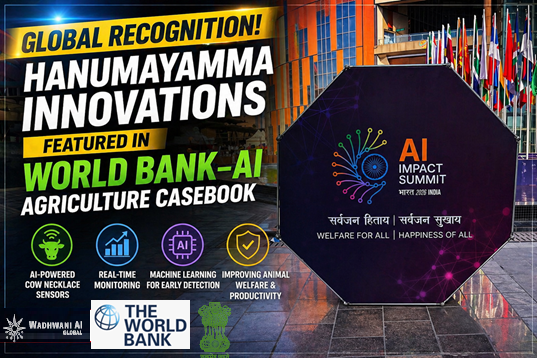
Developed in collaboration with the Government of Maharashtra’s AI and Agritech Innovation Center (AIAIC) and supported by the World Bank and Wadhwani AI, this Casebook presents 26 deployed and scalable AI solutions focused on improving crop planning, strengthening farm operations, expanding market access, and enhancing financial resilience for farmers, reflecting AI’s growing role in agricultural productivity and rural transformation.
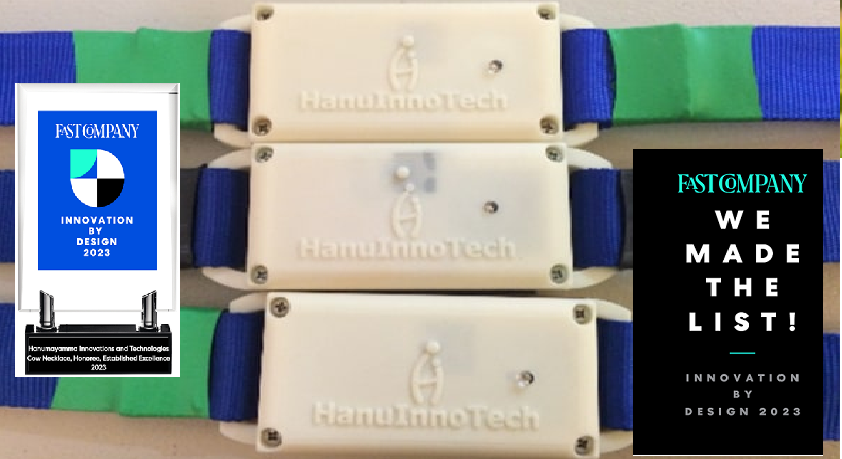
Case Study 12 features Hanumayamma Innovations and Technologies, Inc. and highlights the deployment of AI-powered Cow Necklace Sensors in the Kashmir Valley, demonstrating how wearable IoT and machine learning enable continuous, non-invasive livestock monitoring, early detection of health and climate-induced stress, and proactive interventions that improve animal welfare, productivity, and resilience in extreme environmental conditions, with strong potential for scalable global adoption.
List of successful case studies from our customers:
 Food Industries Coca-Cola partnered with Hanumayamma to deploy an AI-driven Mango Yield, Harvest Calendar, and Supply Chain Platform that forecasts yield, predicts prices, maps global harvests, and optimizes sourcing—reducing costs, stabilizing procurement, and preventing disruptions.
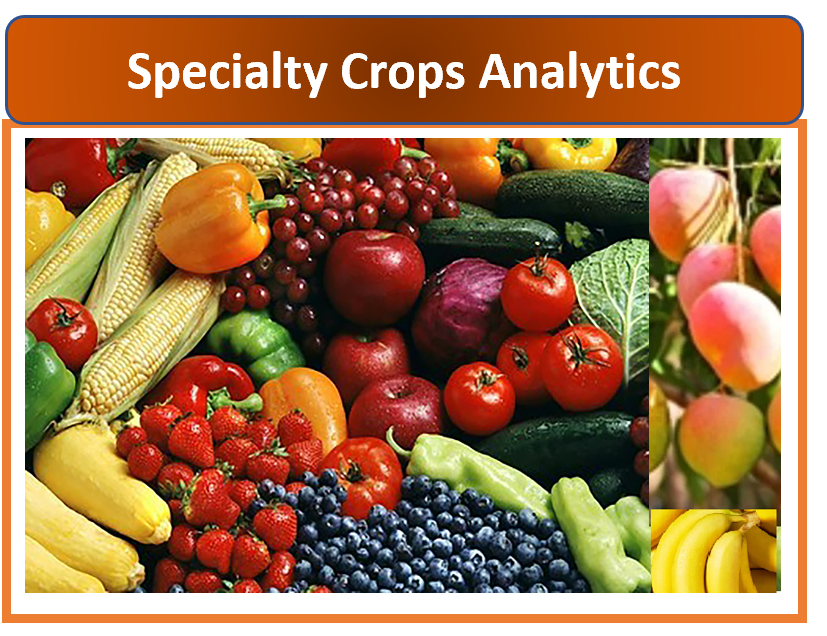
 Producers & Food Processors AI-driven specialty crop intelligence for processing tomatoes integrates climate analytics, price forecasting, and risk modeling to optimize farm decisions, stabilize processor procurement, reduce food waste, and strengthen global food security across volatile agricultural markets.
Agriculture faces many challenges due to factors such as macroeconomics, weather, climate change, wars, tariffs, supply chain problems, and consumer preferences. These factors affect the viability of small farmers. With our platform, we will use advanced analytics to deal with these risks in a proactive way.
 Multiplier Small farm agriculture is an economic multiplier at the gross root level and has a huge positive
influence on Gross Domestic Product (GDP) both globally, and for individual countries.
Multiplier Small farm agriculture is an economic multiplier at the gross root level and has a huge positive
influence on Gross Domestic Product (GDP) both globally, and for individual countries.
 Commodity Markets Forecasting commodity prices plays an important role in the decision making regarding both the planted or harvested acreage of crops, and the financial well being of small farmers.
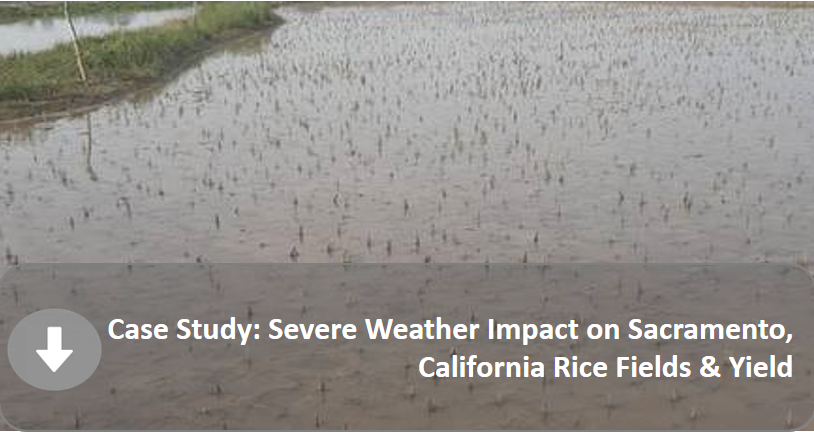
 Extreme Weather The core concept of sustainability is that lasting success requires an integrated approach to producing food and other products.
 Cost Optimization Farming is an expensive process that consists of both internal and external expenses; feed, fertilizers, human labor, equipment, finance, operations, security, and transportation are some of
these expenses.
Cost Optimization Farming is an expensive process that consists of both internal and external expenses; feed, fertilizers, human labor, equipment, finance, operations, security, and transportation are some of
these expenses.
 Risk Modeling Agriculture is filled with uncertainties, risks, losses, and back-breaking work. Yet, the returns on agriculture -- especially for small farmers -- are miniscule or, in some cases, non-existent.

Small-scale farming is a strong economic force at the local level and contributes greatly to the Gross Domestic Product (GDP) of each country and the world. Helping farmers in rural areas has many advantages, such as improved economic performance, lower poverty and inequality, less social conflict, increased food security, economic resilience, and a happier and healthier nation overall. In fact, history has shown the positive effects of small farm agriculture; the agricultural sector of the economy helped our country overcome depression during 1935. Farmers clearly gained from Roosevelt’s devaluation. And because farmers were probably more likely to spend their extra money than most companies or other Americans, the overall economy recovered as well.
Recovery from the Great Depression: The Farm Channel in Spring 1933
The main reason for the slump in the country's manufacturing industry is that farm products have been mostly sold at a loss, which has reduced the buying power of almost half of our population in the local market. We will increase the buying power of the farmer.
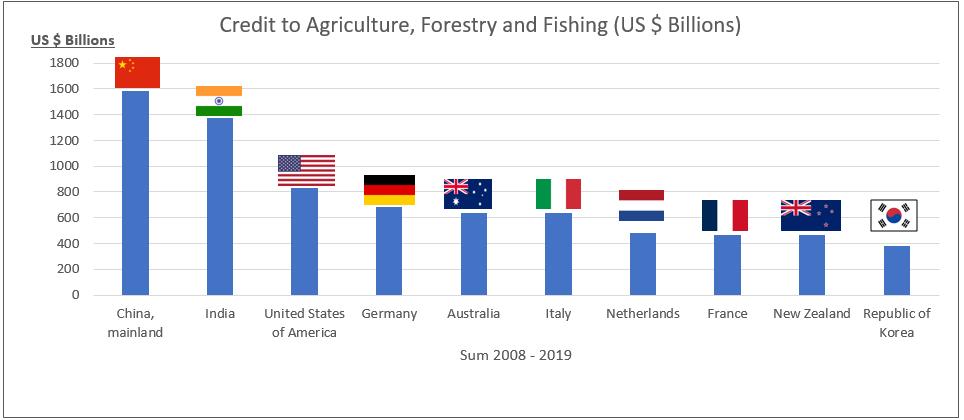
The Hanumayamma Analytics platform examines the credit given to agriculture from over 120 countries on how much money the private/commercial banking sector lends to producers in agriculture, forestry, and fisheries, including household producers, cooperatives, and agro-businesses. The use of statistical methods and econometric models allows the Hanumayamma Agriculture Analytic platform to generate customized recommendations for local farmers with the aim of providing better insights to address any changes in macroeconomic conditions, while ensuring the profitability of small farmers. Commodity Models and Risk Models of the Hanumayamma agriculture platform rely heavily on credit to agriculture data to constantly evaluate global market conditions to protect the small farmer.
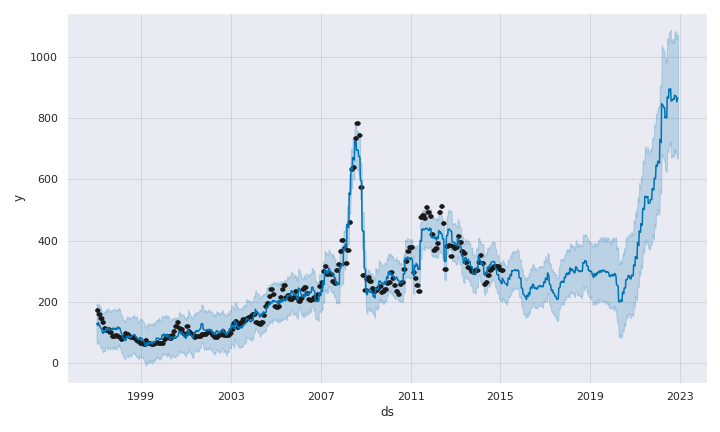
Predicting the prices of agricultural products is crucial for making choices about how much land to plant or harvest crops and for the economic welfare of small farmers. Anticipated prices of farm products can affect the decisions of farmers and ranchers on how much land to use for crops or how many animals to keep and, therefore, influence the availability of farm products.
A farm’s financial situation also depends on how commodity prices change. For instance, when commodity prices stay low for a long time, farms earn less money and need to borrow more, making them more exposed to higher interest rates and other economic shocks. When commodity prices stay high for a long time, farms can make more money and cope better with economic changes. Commodity price changes also affect food security: when prices are low for a long time, consumers can buy enough food more easily, while when prices are high for a long time, their food security is reduced, especially in developing countries.
Agricultural product prices behave in a peculiar way and need special attention. Agricultural Commodity Markets respond to macroeconomic factors, oil prices, supply and demand, consumer preferences, bad weather, biofuels, stocks and consumption, dollar rates, speculation, food storage, speculative activity, financial markets, fertilizers, trade barriers, national income, and other economic situations. Commodity prices increase with economic growth, money supply, weather, and inflation (bubbles), but decrease with interest rate.
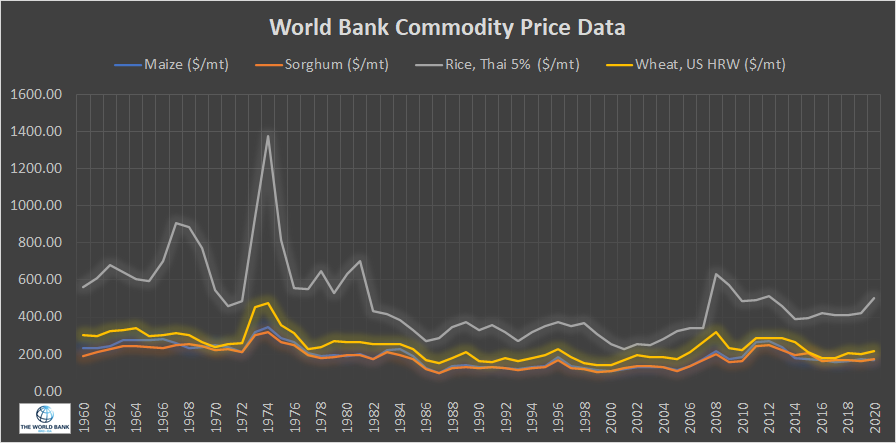
The Hanumayamma Agriculture Analytics platform examines changes in commodity price from various data sources, such as the World Bank Pink Sheet Data, The Food and Agriculture Organization (FAO) of the United Nations, The United States Department of Agriculture (USDA), private equity markets, stock indexes, and other local, state, and national commodity markets. Moreover, the Hanumayamma Agriculture Analytics platform continuously calculates food index inflation on local, national, and international markets to find and analyze price movements and trends. The aim of our platform is to offer proactive suggestions to small farmers to help them better plan farm level, micro economic activities, such as the best time to purchase fertilizers and sell crops.
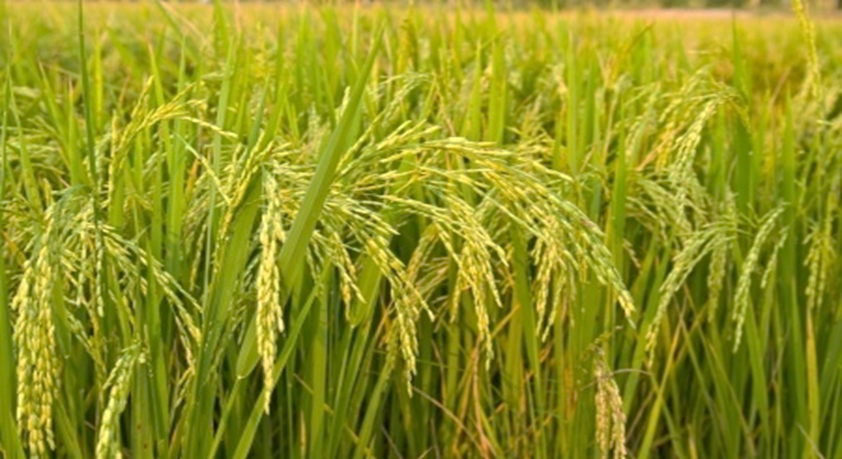
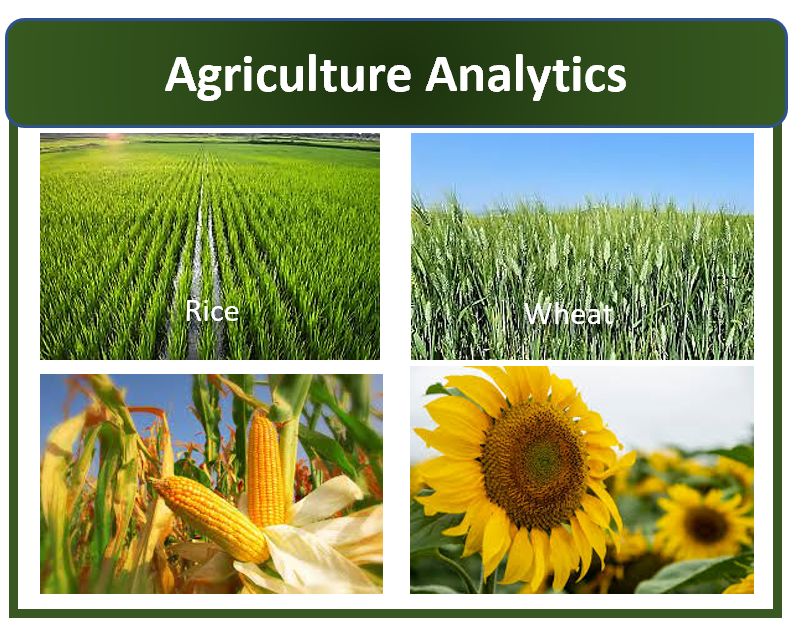
India is one of the world's most populated countries and has one of the highest economic growth rates among big economies since 2001. India also produces and consumes a lot of different crop and livestock products. The Heat Wave in March 2022 greatly affected the wheat production!
We focus on three main states: Uttar Pradesh, Madya Pradesh, and Punjab. Both Uttar Pradesh (UP) and Punjab are known as Wheat breadbasket of India and Punjab has been India's “grain bowl" with wheat and rice farming supported by the government since the 1960s. It usually gives the most to India's national reserves and the government had planned to purchase about one-third of this year's supply from the region.
India's main grain crop is wheat. In 2018, the crop covered about 29.8 million hectares of land and it expanded to 31.6 million hectares in 202110. The country's wheat output has risen significantly from 75.81 million MT in 2006-07, 94.88 million MT in 2011-12 to a record high of 107.85 million MT in 2019-2011. The wheat yield which was 2602 kg/hectare in 2004-05, 3140 kg/hectare in 2011-12, and has increased to 3440 kg/hectare in 2019-20. A large increase in the wheat yield has been seen in the states of Haryana, Punjab, and Uttar Pradesh. Higher area under the crop has been reported from Madhya Pradesh (MP) in recent years.
The Hanumayamma Agriculture Analytics platform monitors changes in commodity price from data sources such as the World Bank Pink Sheet Data, the Food and Agriculture Organization (FAO) of the United Nations, the United States Department of Agriculture (USDA), private equity markets, stock indexes, and various other local, state, and national commodity markets. Moreover, the Hanumayamma Agriculture Analytics platform continuously calculates food index inflation on local, national, and international markets to identify and determine price changes and trends. The aim of our platform is to provide actionable suggestions to small farmers so as to better plan farm level, micro economic activities such as the optimal time to buy fertilizers and crop commerce.
Hanumayamma Innovations has a variety of experience in data analytics, agriculture analytics, and dairy analytics. It works with private and public organizations to create and use climate change analytics for small farmers and agricultural economies. This helps them make better decisions and keep agriculture sustainable. Sustainability is based on the idea that long-term success depends on a holistic approach to making food and other products, farm profitability, quality of life for farmers, workers, and communities, and conservation of natural resources. That means, sustainability requires acknowledging and addressing productivity, as well as economic, social, and environmental goals as a simultaneous set of system attributes.
Sustainable Agricultural Systems Science White Paper U.S. Department of Agriculture
The National Research Council (NRC) report, “Toward Sustainable Agricultural Systems in the 21st Century,” effectively summarized the current state of science and practice in the United States. It documented a considerable, science-based advancement in American agriculture: producing more food and fiber on the same acreage as a century ago with less labor, energy, and water per unit of output and considerably less soil erosion.
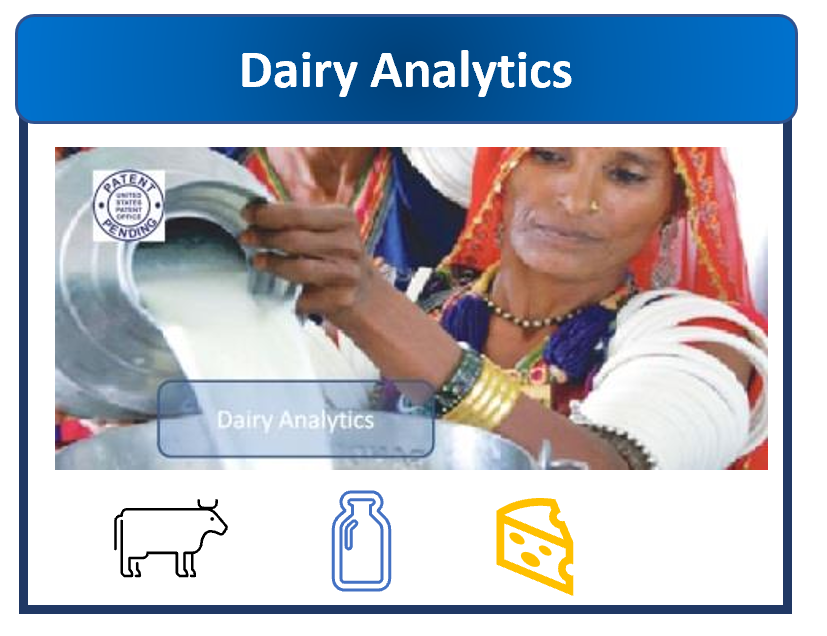
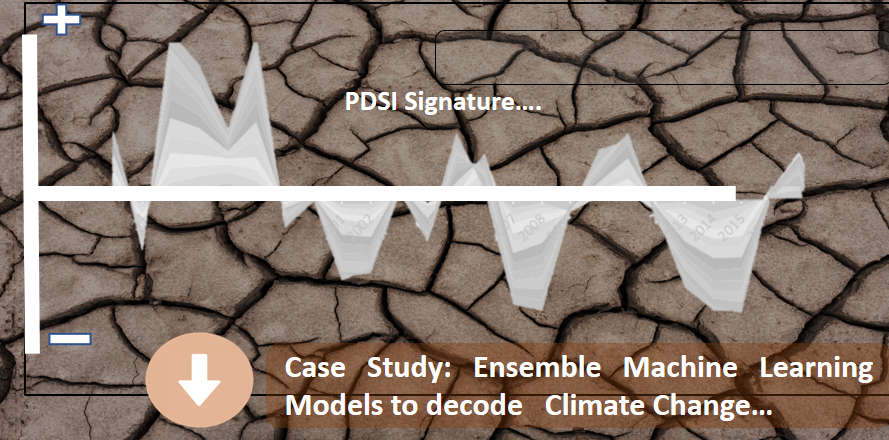
Hanumayamma uses data from sensors, crop yields, commodity prices, historical climate, humidity, PDSI, rainfall, weather patterns, and storm events and frequencies to model climate change for an agricultural analytics platform. Hanumayamma also provides climate modeling to small scale farmers through Dairy Analytics. The Hanumayamma Cow Necklace Sensor has integrated climate models to create predictive analytics for farmers.
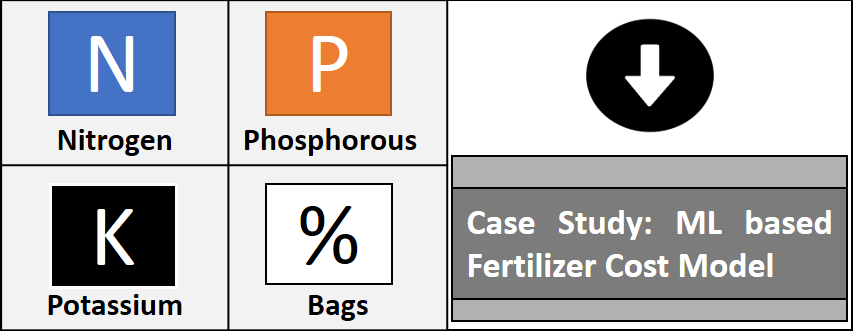
Fertilizer cost prediction could have a significant effect on developing economies, and therefore a life-saving impact on them as well. To explain, fertilizer cost prediction could lower the debt of farmers. A 2018 study by the National Bank for Agriculture and Rural Development in India showed that 52.5 percent of all agricultural households had debt, according to the current banking rules that prevent farmers with existing loans from getting more credit. Therefore, indebted families who need credit often force female farmers to borrow money, which worsens the debt trap that is very common in the western Indian region, and in many developing countries where farms have fallen into repeated debt because of the cost of fertilizers and low yield crops . Data published earlier this year showed that India had 93 million microfinance accounts, most of whom were women in self-help groups: an increase of 22 percent from the previous year. Microfinance interest rates are much lower than those offered by private money lenders, who do well in these areas.
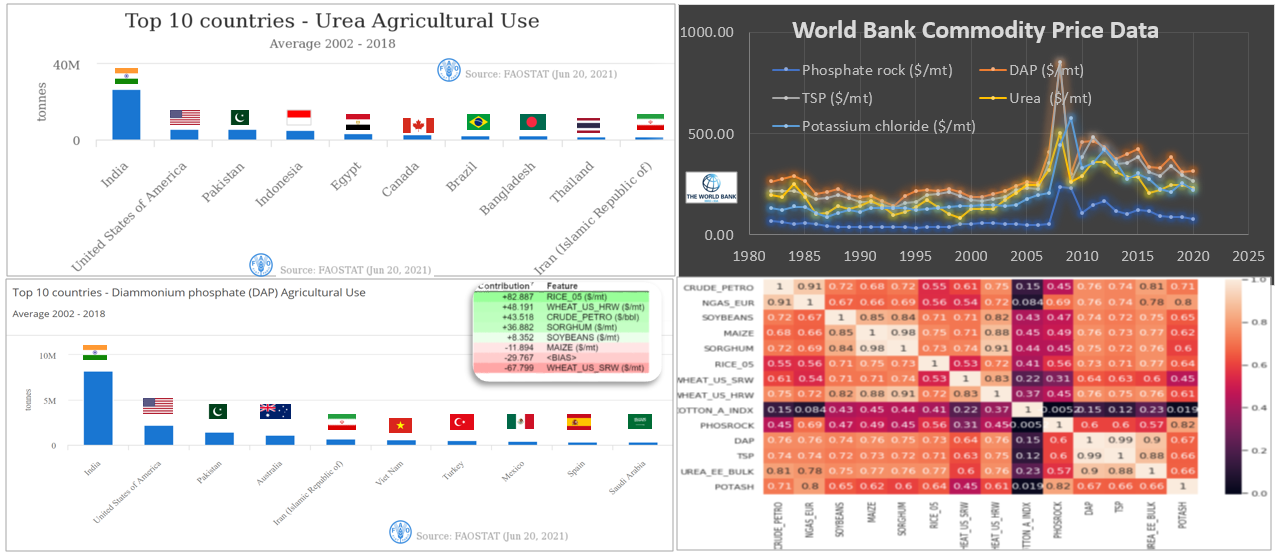
 Try Our Fertilizier Price Predict
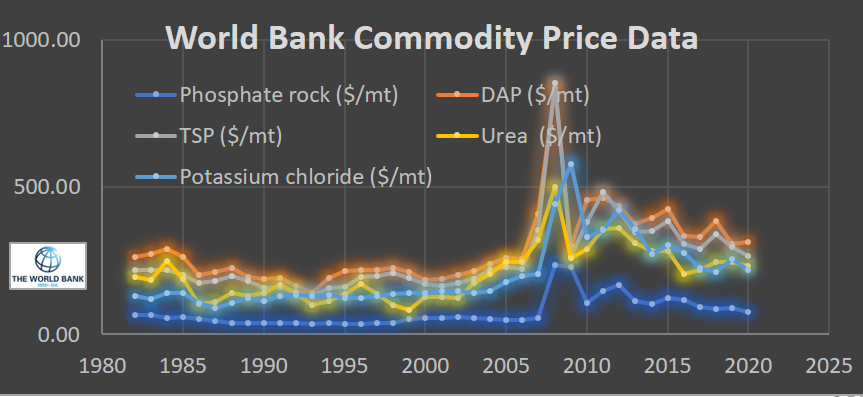
Fertilizer Price Predict Model uses the World Bank Pink Sheet Data as a source. The Machine Learning model that was created takes into account how the variation of Fertilizer Price is affected by the demand for Commodities. For example, higher demand of Commodities such as Rice or Wheat puts pressure on the production side. This leads to more use of Fertilizers. Also, on the Supply side, one of the key ingredients for making Fertilizer is Crude Oil or Natural Gas (depending on the production method). By incorporating both demand and supply side factors, we can give Small Farmer some insight into the direction of Fertilizer prices. As per the World Bank pink sheet data, the following are common Fertilizers used:

The Hanumayamma Analytics platform offers the best cost reduction for saving on fertilizer expenses for small farmers. Hanumayamma's forecasting analytics and heuristic linear programming modules give practical guidance to small farmers on how to use fertilizer efficiently and lower agricultural costs such as seeds, equipment, fertilizer, and human labor-- leading to a more prosperous and abundant world with wealthy small farmers.
Farming is a very uncertain, risky, costly, and hard occupation. The rewards from farming-- especially for small farmers-- are very low or sometimes non-existent. It makes sense that many small farms, both in the U.S. and in other countries, have vanished. Farmers have to deal with two types of risks: internal and external farm risks. Internal farm risks -- risks related to soil, fertilizers, crop growth stages, and personal/family issues -- can be managed by farmers. External risks, on the other hand, are outside of a farmer’s control; things like changes in commodity prices, macroeconomic conditions, unexpected outcomes of real-time price models, trade wars, sudden shifts in people's preferences & views of a food commodity, and global climate change are examples of such external risks.
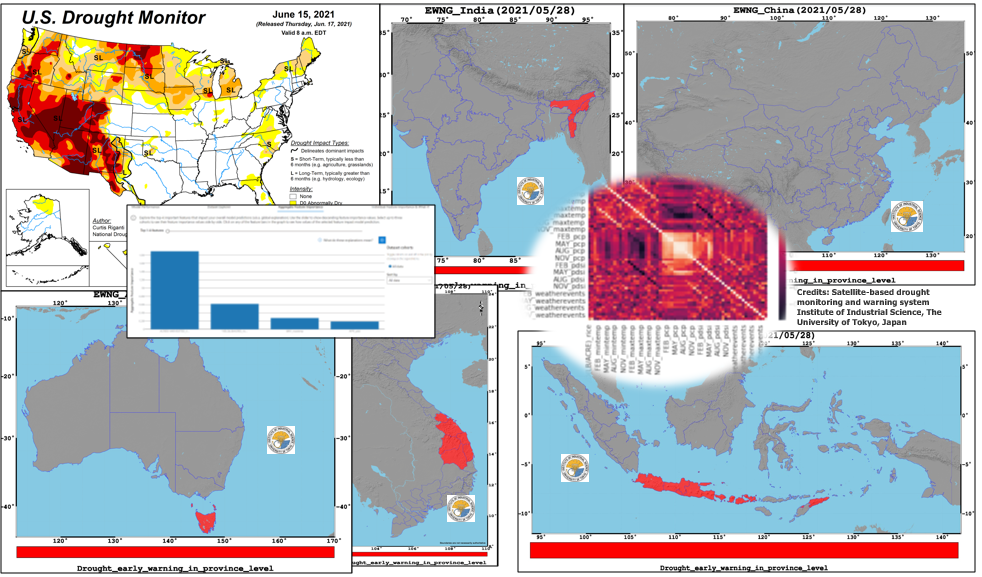
Specifically, the effects of climate change & weather events on agriculture have important implications for every industry and service sector of the economy. It is reasonable to suggest that weather events leave their mark on macroeconomic indicators and Gross Domestic Product (GDP). For example, the direct influence of weather events can be observed in construction, retail, agriculture, oil & gas, entertainment, travel, and public health. The project cost estimation, schedule, delivery, and productivity of business-related activities of these industries depend on the weather. Adaptive analytics is essential for understanding and planning for the impacts of weather events on agriculture.
The combination of commodity models and weather model events, along with the use of ensemble machine learning models, act as the best signal collectors; they can forecast crop yield and give information about the history of weather events to reduce small farmer risk.
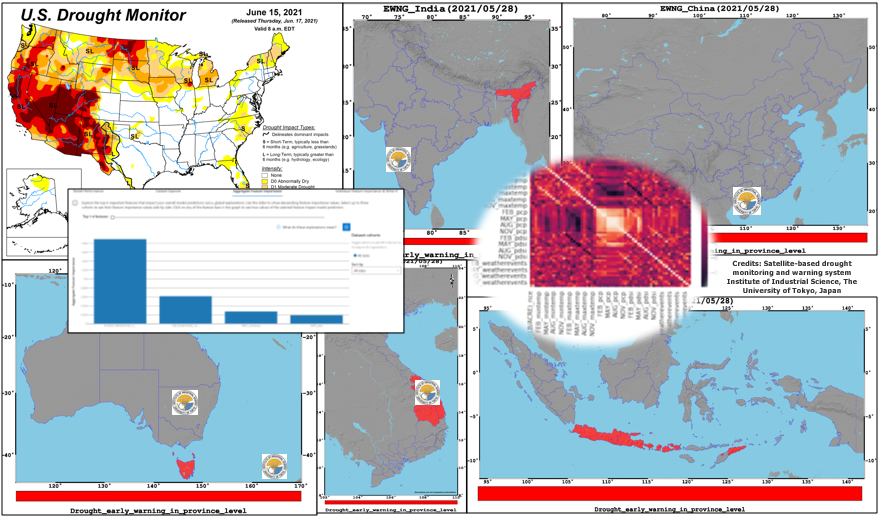
The Hanumayamma Analytics platform continuously analyzes climate data, storm data, and weather data to update agriculture risk models that can help small scale farmers comprehend the effects of climate change on agriculture outcomes. Our goal is simple and straightforward: all farmers should be able to access artificial intelligence improved insights and the advantages they can bring. Data and analytics is an additional, but vital, harvesting tool that every farmer around the world deserves! That's it!
The world is in a critical situation. In 2020, almost one third of people did not have enough food - hunger affected between 720 and 811 million people. Compared with 2019, 46 million more people in Africa, nearly 57 million more in Asia, and about 14 million more in Latin America and the Caribbean faced hunger. Based on projections of global population growth, current gap to feed people around the world, and increased demand for greener fuel & biodiesel, food security will remain a key economic development issue for the next several decades. As the tension between food and fuel worsens, the day will come when more agricultural products will be used for energy than food. Adding to the problem, the COVID-19 pandemic has changed the earth in terms of supply chain, resource availability, and human labor and has exposed our weaknesses in food security to a greater extent. In conclusion, humanity is in a critical situation and what this unprecedented change in our lives has forced us - the farmers and technologists of the world - to do is to innovate and become more productive to address the multiple food security challenges.
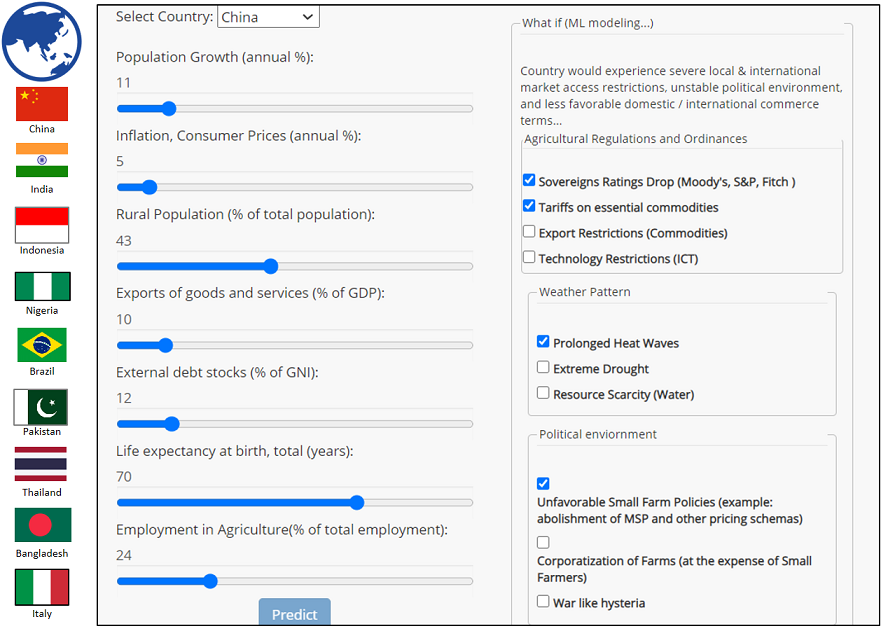
Hanumayamma Machine Learning and Artificial Intelligence platform examines the variations in macroeconomic data, weather data, climate data, and agricultural output and productivity data to evaluate food security trends and offer practical solutions!
Hanumayamma Dairy Cow Necklace sensors gather data from the field in real time and compare the changes in weather and climate patterns to give timely suggestions to small farmers.